

Learn how to clean, measure, and analyze event attendee data to understand behaviour, improve engagement, track accessibility needs, and make better event decisions.
Most event teams collect plenty of attendee data. Registrations, check-ins, session attendance, survey responses, ticket purchases. Then the event ends, the spreadsheet is exported, and most of that information is never used.
So clearly, the problem isn't a lack of data. It's knowing what to look for and how to use it.
In this guide, we'll look at how to:
→ Clean and standardize attendee data
→ Measure attendance and engagement
→ Understand attendee behavior
→ Track accessibility needs
→ Build long-term attendee relationships
→ Turn your findings into better event decisions
Hopefully, by the end of this guide, you'll have a clear scope on how to handle and evaluate the attendee data you collect from our events. But first things first;
Start With Clean Attendee Data
Before you analyze anything, make sure your data is accurate.
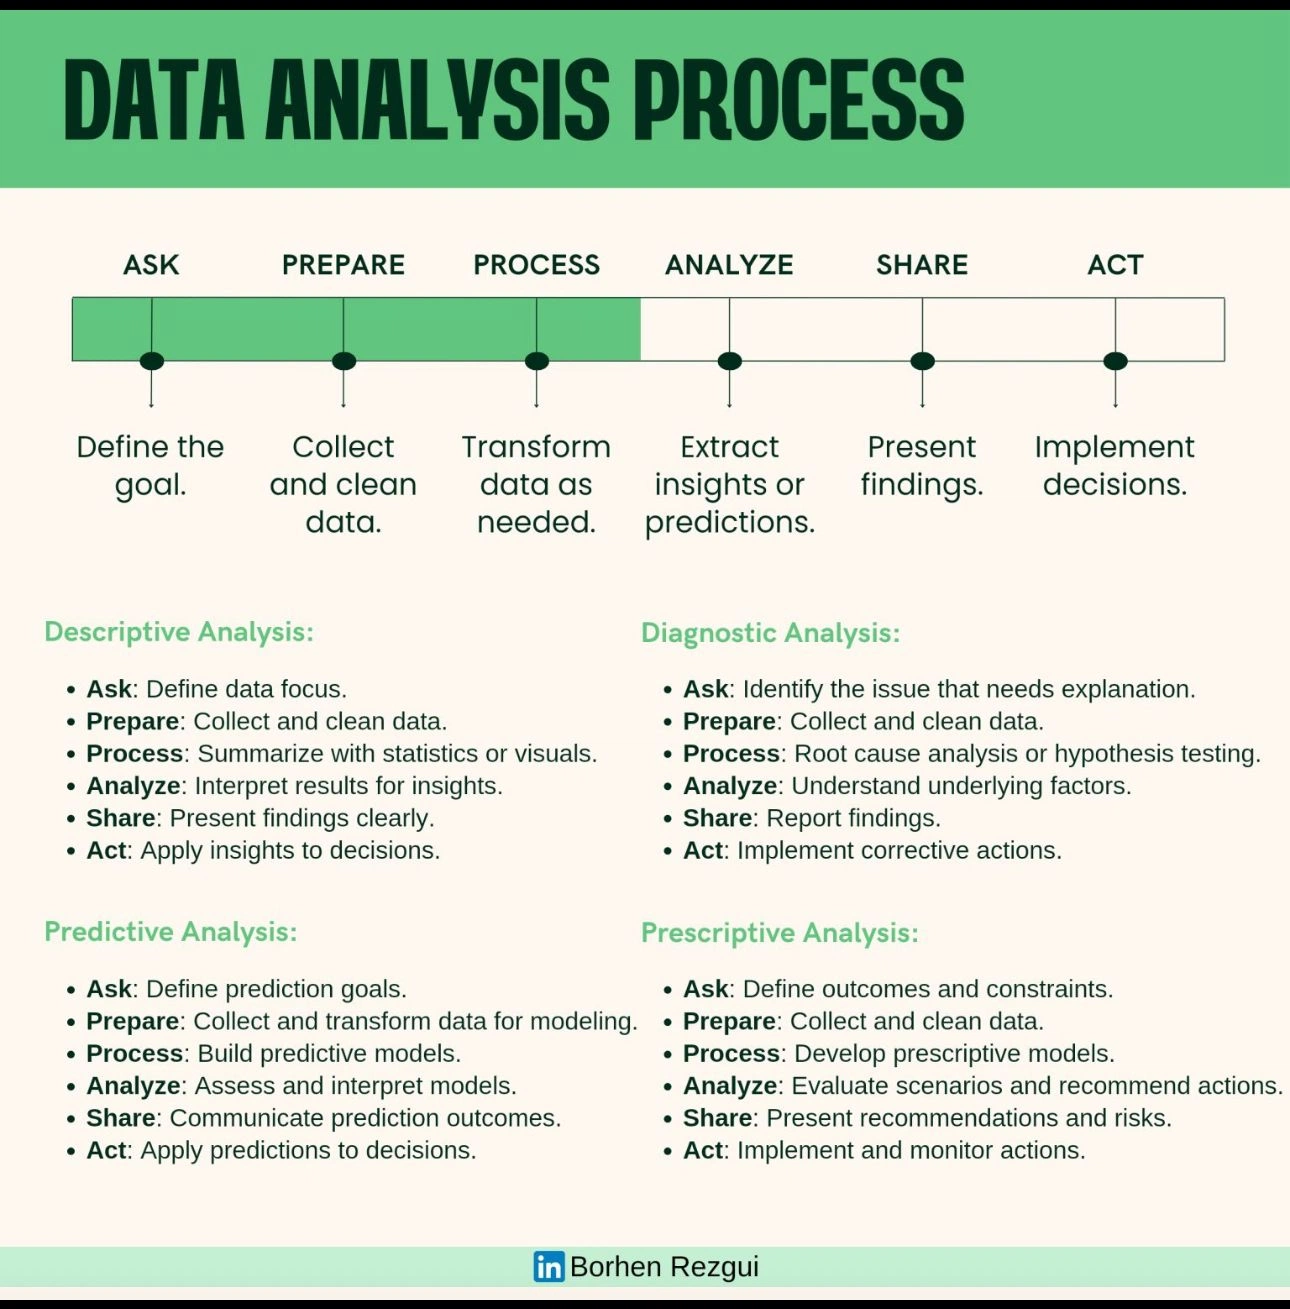
Duplicate registrations, inconsistent company names, missing information, and mismatched ticket records can throw off your reporting before you even start.
For example, one attendee might appear as "Jane Smith," "J. Smith," and "Jane Smith Ltd." If those records aren't connected, your reports might count one person three times or place them in the wrong segment.
Start by:
→ Deduplicating attendee records
→ Standardizing names, companies, job titles, and dates
→ Checking ticket and attendance records against venue capacity
→ Keeping dietary, accessibility, and consent information consistent
Clean the data as it comes in rather than waiting until after the event. Your reports, communications, and event decisions all depend on it.
Measure Reach With the Right Numbers
Start with the basic numbers, but don't stop there.
1. Attendance Rate
Your attendance rate shows how many registered attendees actually showed up.
Attendance Rate = Total Attendees ÷ Total Registrants × 100
For example, 400 attendees out of 500 registrations give you an 80% attendance rate.
Typical conference attendance is around 60–80%, while webinar attendance is often lower, at 40–60%. So use these as reference points, not rules.
2. Registration Source
Don't look at attendance as one big number. Break it down by source.
Did attendees come from:
→ Social media
→ Partner referrals
→ Paid campaigns
→ Organic search
A channel that brings in fewer registrations but produces a much higher attendance rate might be more valuable than a channel that drives volume but lots of no-shows.
If you’re ready to go a step further and make your data actually actionable, the first step is building a clear tracking structure before your event even starts. This free template shows you exactly what to track before, during, and after your event so you can avoid messy spreadsheets and missing insights later on.
👉 Download the free Event Tracking Plan template
3. Registration Conversion
Track the journey from website visit to registration.
If 1,000 people visit your event page and 50 register, your registration conversion rate is 5%. That gives you a starting point for improving your messaging, page layout, pricing, or registration process.
Go Beyond Attendance to Understand Behaviour
Attendance tells you who showed up. Behaviour tells you what they actually did. That distinction matters.

Start tracking actions such as:
→ Session check-ins
→ Poll participation
→ Q&A activity
→ Networking meetings
→ Resource downloads
→ Sponsor booth visits
→ Time spent in sessions
A session with 200 attendees isn't automatically more successful than one with 100. If those 100 attendees stayed longer, asked more questions, downloaded more resources, and participated in polls, the smaller session might have created more value.

Read more on how to measure event success
Having real-time dashboards can also help you act in real time. If one room is packed while another is nearly empty, you have an opportunity to investigate why and, where possible, adjust the experience.
Live metrics such as session scans, dwell time, poll activity, Q&A volume, and lead scans are useful signals for this.
Use Engagement Data to Prioritize Follow-Ups
Attendee behaviour can also help your sales or partnerships team decide who needs follow-up first.
Someone who attends a private demo, visits a sponsor booth, downloads a product guide, and books a meeting has shown more intent than someone who only attended the keynote.
You can assign different weights to these actions and group attendees into cold, warm, and hot leads. That gives your team a clearer starting point for follow-up.
Want to know what to track before, during, and after your event? This guide covers that.
Track Accessibility as Part of the Attendee Experience
Accessibility data shouldn't sit in a separate corner of your event planning. It should inform the experience from registration to check-out.

Ask attendees about needs such as: wheelchair access, sign language interpretation, sensory accommodations, dietary restrictions, and other support requirements.
Then use that information to make operational decisions.
If 10% of attendees need gluten-free meals, your catering plan should reflect it. If several attendees require wheelchair access, venue layouts and room assignments need to account for that before the event starts.
You should also track how many attendees request different accommodations. Over time, that data helps you understand what your audience needs and budget accordingly for future events.
Look at the Full Attendee Lifecycle
An event shouldn't become irrelevant the moment the last attendee leaves.
Your attendee data also gives you insight into what happens between events. So, as a starting point:
Compare New and Returning Attendees
Track how many attendees are:
→ First-time visitors
→ Returning attendees
→ Repeat customers
→ New members
→ High-engagement attendees
A growing repeat-attendee rate is a strong sign that your event is delivering enough value to draw people back.

Looking at attendance, repeat participation, and renewal trends over time gives you a much clearer picture of community health than a single post-event survey.
Keep the Relationship Going
Use attendee data to build relevant follow-up.
A first-time attendee might receive a welcome series. A repeat attendee might get an early invitation to your next event. Someone who engaged heavily with a specific topic might receive related content or an invitation to a smaller session.
The goal is to move from one event to an ongoing relationship.
Compare Events Over Time
Look for patterns across your event history. Track things like:
✔ Attendance growth
✔ Repeat-attendee rate
✔ Engagement levels
✔ Membership or community conversions
✔ Session performance
If attendance drops at the same time every year, or a particular session format consistently performs well, your historical data gives you something to work with before planning the next event.
PS: Here's a more detailed guide on event tracking.
Turn Your Data Into a Story Stakeholders Understand
Your post-event report shouldn't be a dump of every metric you collected, PLEASE!
Your report should explain what happened, why it matters, and what you recommend doing next.
Start with:
→ Event goals
→ Key results
→ Attendance and engagement
→ ROI or other relevant outcomes
→ Major findings
→ Recommended actions
Use charts and visuals where they make the data easier to understand. Then turn those findings into clear next steps.
For example:
"Session 3 had the highest attendance" is a finding.
"Session 3 had the highest attendance and 40% more Q&A participation, so we should add more content in this format next year" is an insight.
That's the difference between reporting data and using it.
Share the right level of information with each stakeholder, too. Sponsors need sponsor performance. Leadership needs business impact. Event teams need operational and attendee insights.
💡 You can also share selected results with attendees. Showing people that their feedback led to changes builds trust and gives them another reason to come back.
Make Attendee Data Part of Your Event Strategy
Analyzing attendee data isn't a task you complete once the event ends. It's a cycle.
→ First, you clean the data.
→ Then, you measure what happened.
→ Then you understand why.
→ After that, you act on the findings.
→ Lastly, you use what you learned to make the next event better.
And so on and so on.
You don't need to track everything from day one. Start with one area, like registration conversion, session engagement, or accessibility requests, and build from there.
Mingloft brings registration, ticketing, engagement, and attendee data together so you spend less time piecing reports together and more time using the information to improve your events.
Ready to turn attendee data into better event decisions? Try Mingloft free today.
Mingloft Team
Event planning insights and platform updates from the Mingloft team.
Share